 AA Global
 Swing Points: How To Mark Them Correctly (Free Guide)
Key takeaways
- A swing high is one candle with lower highs on both sides; a swing low is one candle with higher lows on both sides
- That single candle is where the market changed direction, which is why the level matters later
- A broken swing high becomes support in an uptrend; a broken swing low becomes resistance in a downtrend
- Never trade the touch alone: demand an engulfing candle, rejection wick or fair value gap at the level
- Stop beyond the most recent swing, target the next swing on the opposite side
The map most traders never draw
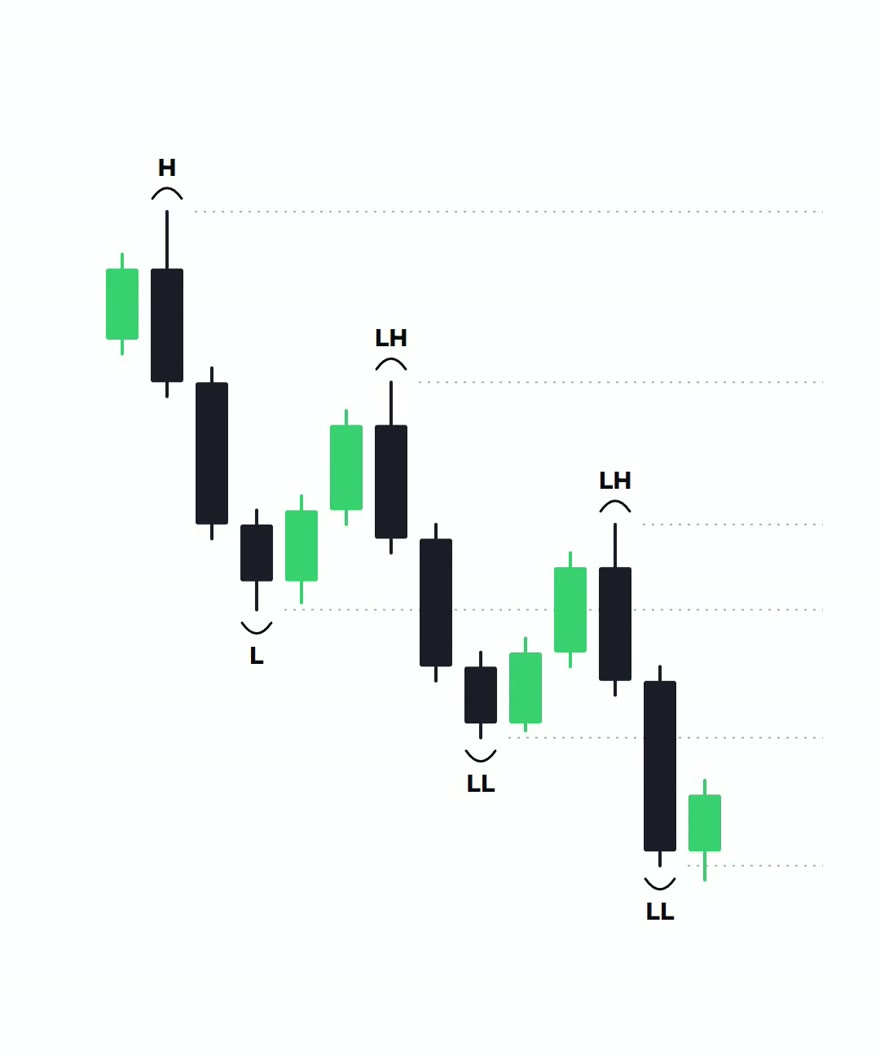
Strip the indicators off any chart and what is left is this: a sequence of swing highs and swing lows. Mark them correctly and you can read the trend, the pullbacks and the levels that matter, all from raw candles. Mark them wrong and every "support" and "resistance" you draw afterwards inherits the mistake.
Step 1: The swing high, defined
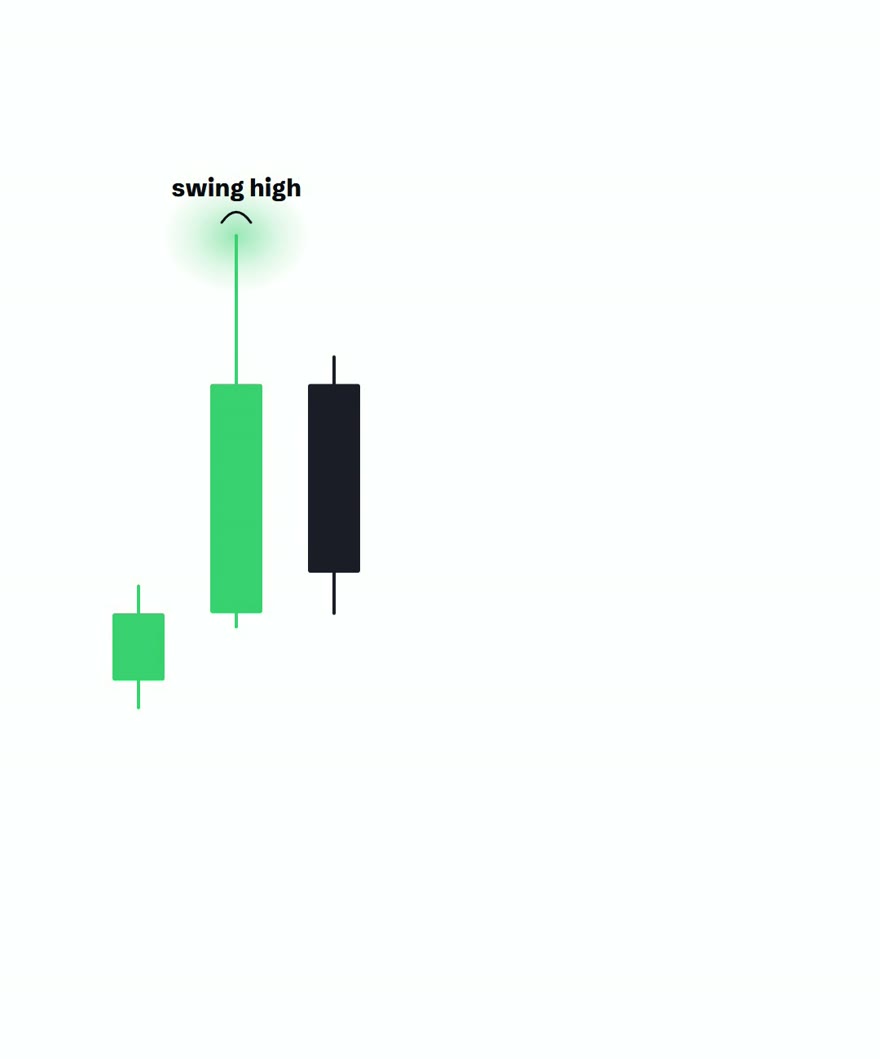
A swing high is one candle with a lower high on each side of it. Nothing more. If the candle to the left and the candle to the right both have lower highs, the middle candle is your swing.
Step 2: The swing low is the mirror
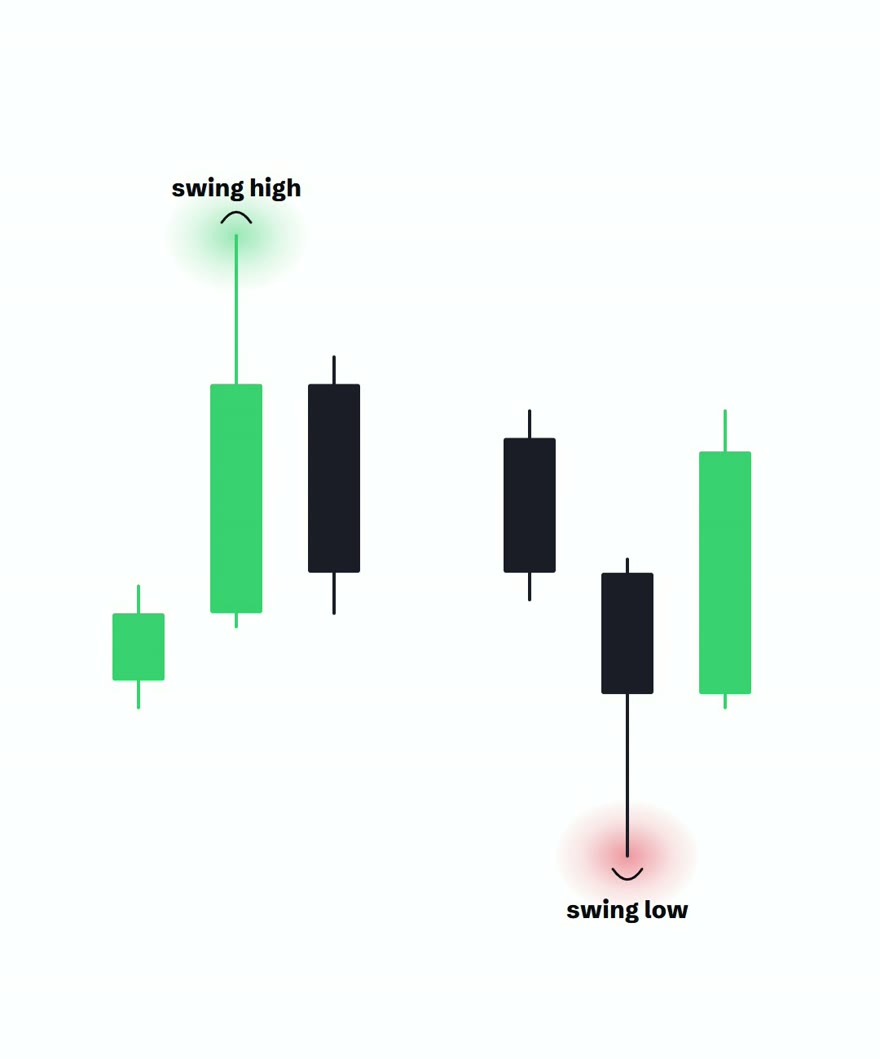
A swing low is one candle with a higher low on each side. That single candle is where the market changed direction: sellers ran out, buyers took over. The reason swing points matter later is exactly that, they are the footprints of a real change in control.
Step 3: In an uptrend, broken swing highs become support
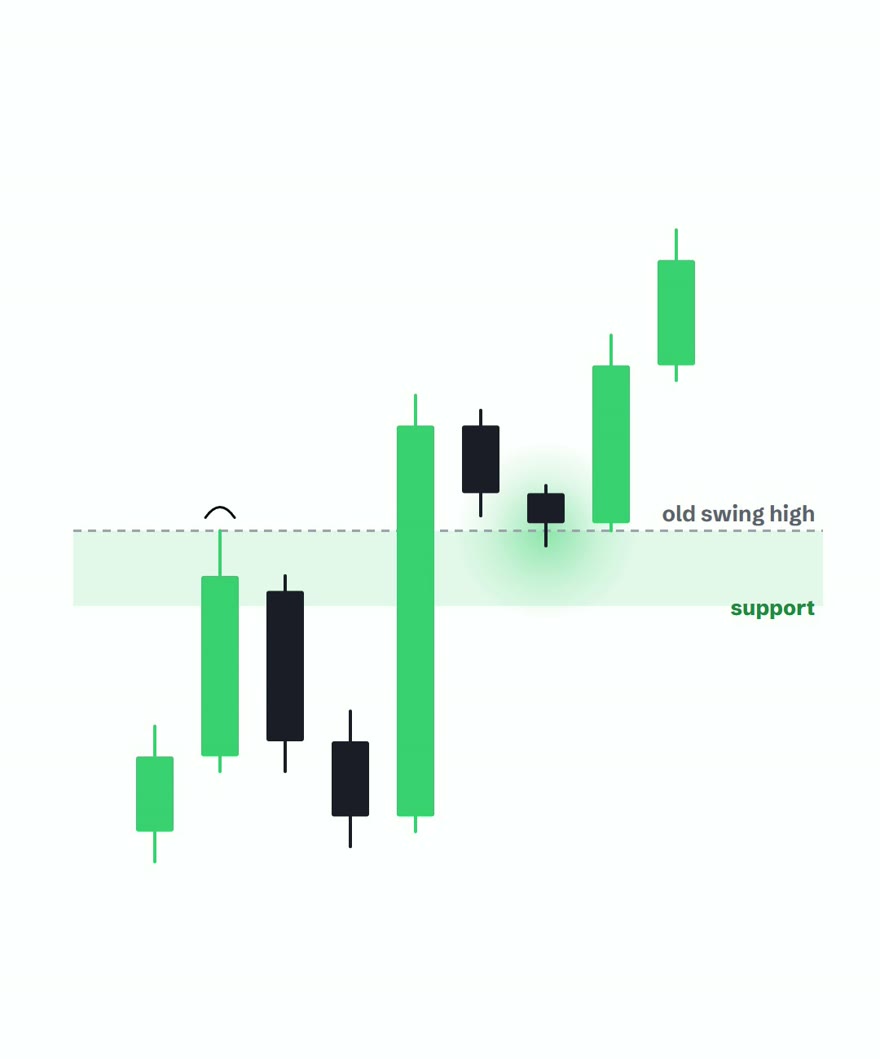
When price breaks above a swing high with force, that old level does not disappear. It flips. The broken swing high starts acting as support, and the pullback into it is where you hunt buys, with the trend, at a level the market has already proven it cares about.
Step 4: In a downtrend, it flips
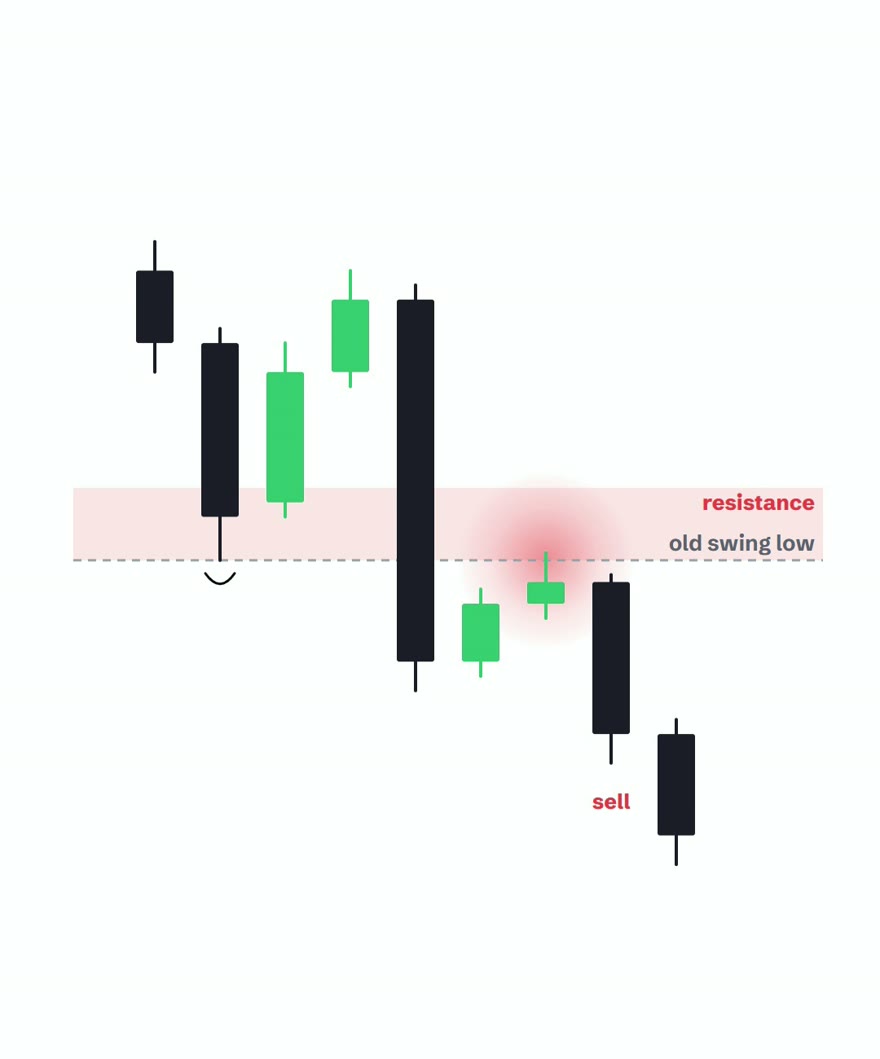
Same logic, mirrored. A broken swing low acts as resistance in a downtrend. The bounce back into that level is where you hunt sells. Notice you are never chasing the move, you are waiting for price to come back to structure.
Step 5: Make the level prove itself
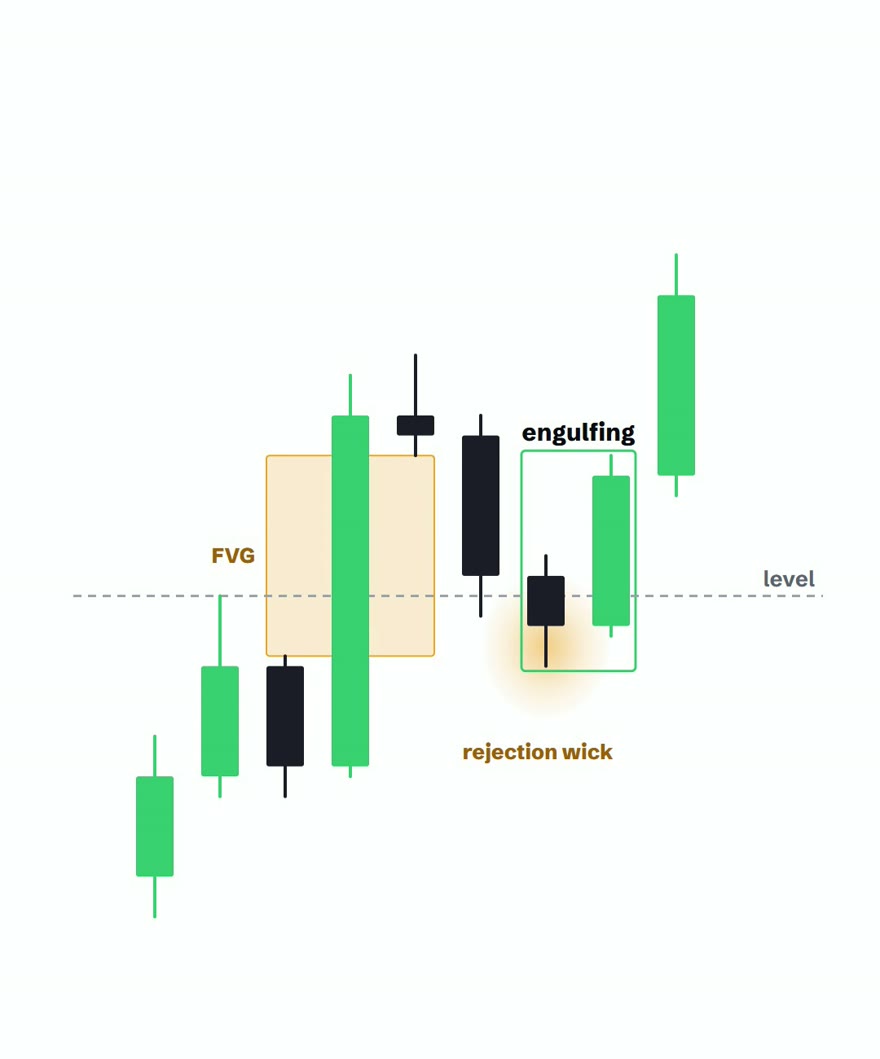
Don't take every touch. A tag of the level with no reaction is not a setup. Wait for one of three confirmations right at the zone: an engulfing candle, a rejection wick, or a fair value gap left by the leg that broke the swing (price pulling back into that gap is the market re-testing its own displacement). If none of them show up, the level failed the audition, skip it.
Want the full entry method built around that third confirmation? It has its own guide: the fair value gap entry.
Step 6: Stop beyond the swing, target the next swing
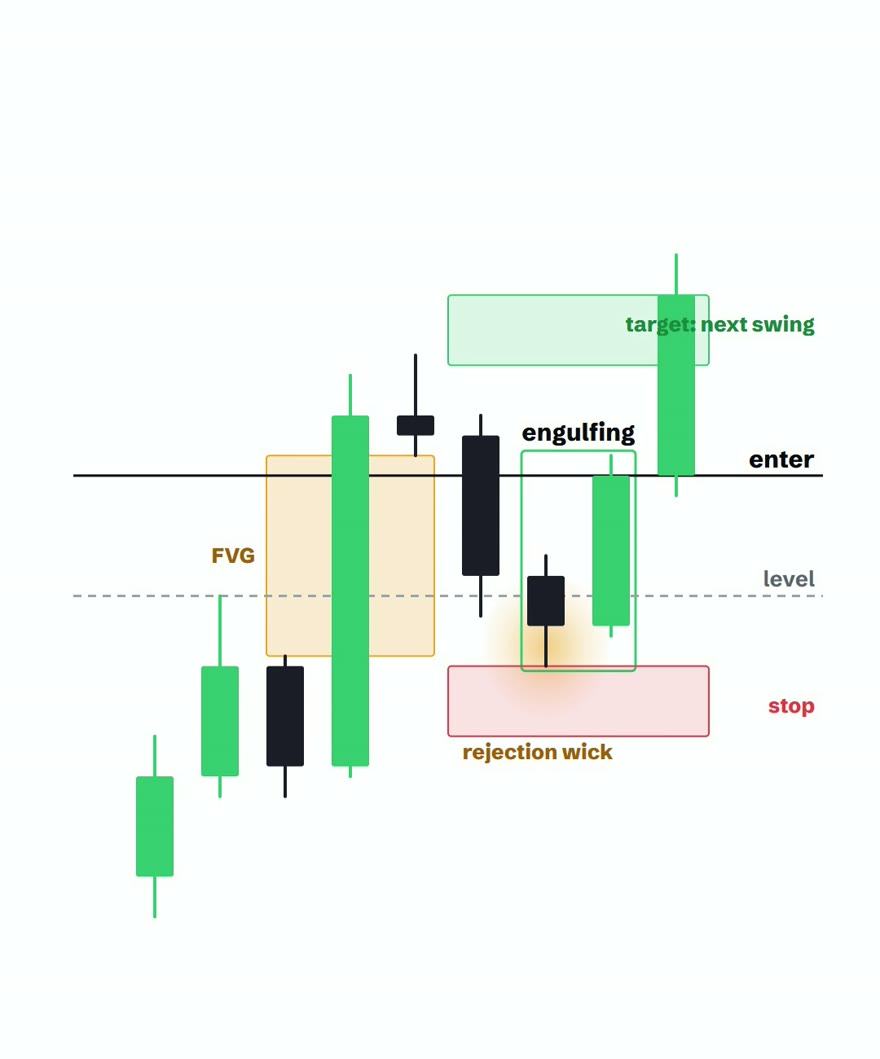
Entry at the confirmation. Stop beyond the most recent swing point, so the market has to actually break structure to take you out, not just wiggle. Target the next swing on the opposite side. Both ends of the trade are anchored to structure, nothing is arbitrary.
Watch the full breakdown
Before you trade it
Drill the retest entry on the free entry trainer, check every live setup against the pre-trade checklist, and build the foundations with the free beginner course if you need them. Then 20 demo trades before a cent of real money.
Try trading free, $10,000 virtual demo →Frequently asked questions
What is a swing high?
What is a swing low?
Why do most traders mark swing points wrong?
What happens when a swing high breaks?
Do I enter as soon as price touches the old swing?
Where do the stop and target go?

Keep learning
Swing points feed straight into the entry method: read the fair value gap entry guide next. New to trading entirely? Start with the free beginner course: 20 short lessons from zero to your first demo trade.