 AA Global
 Trading Sessions Explained: Asian, London and New York (Free Guide)
Key takeaways
- The trading day runs in three sessions, and each one has its own personality
- Asian session: quiet range that builds the levels which matter later
- London: the biggest session, sweeps the Asian range and starts the real trend
- The London to New York overlap (about 13:00 to 17:00 UTC) is the most volatile window of the day
- Want movement, trade London and the overlap. The Asian session is for patience, not action
- Each session leaves a high and a low behind, and those six lines are the levels the next session hunts
- After 9:30 New York price reaches for one of them, because that is where the stops sit
- Once a level is taken it either reverses, or the reversal fails and you trade the continuation instead
Why the market goes quiet, then explodes
Ever notice the chart doing nothing for hours, then moving more in twenty minutes than it did all morning? That is not random. The trading day is three sessions taking turns, and each one behaves differently. Once you can see which session you are in, half the confusion disappears: you stop expecting trends from a window that only ever ranges, and you stop sitting out the window that actually moves.
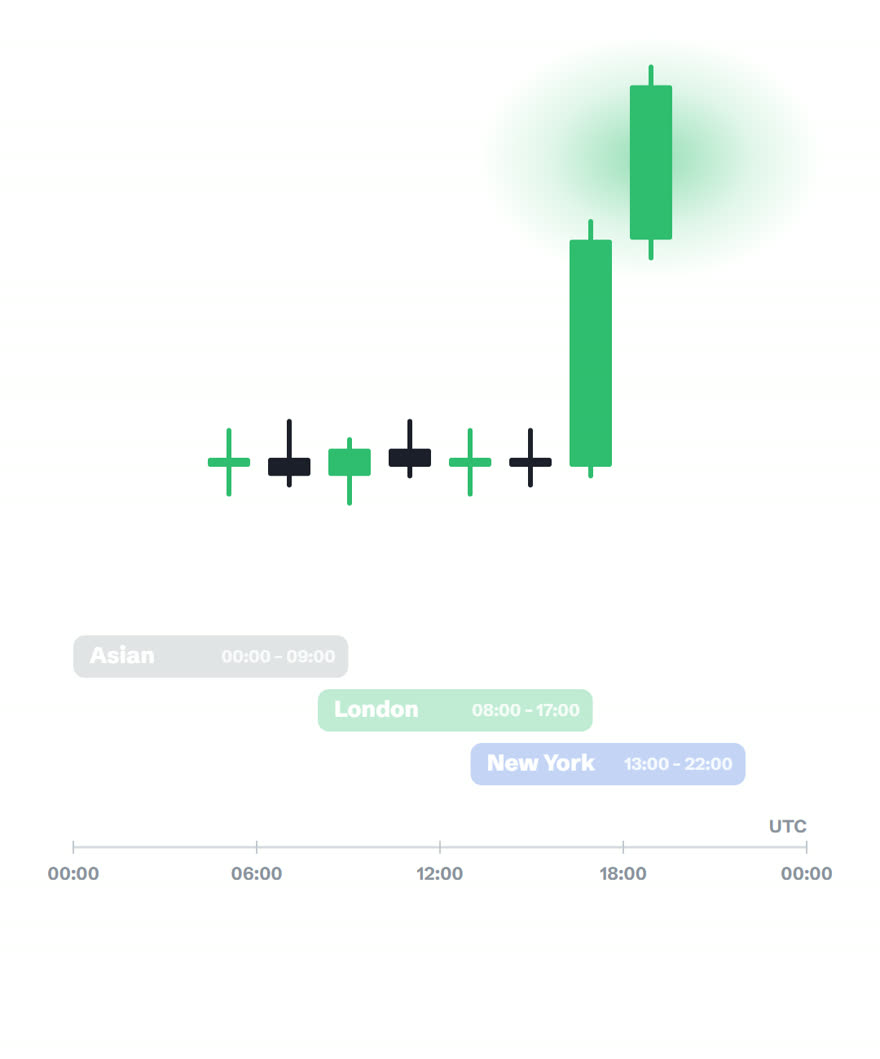
Every image below is a still from the video, so you can follow along frame by frame. All times are UTC; they shift by an hour with daylight saving.
Session 1: Asian, the quiet builder (00:00 to 09:00 UTC)
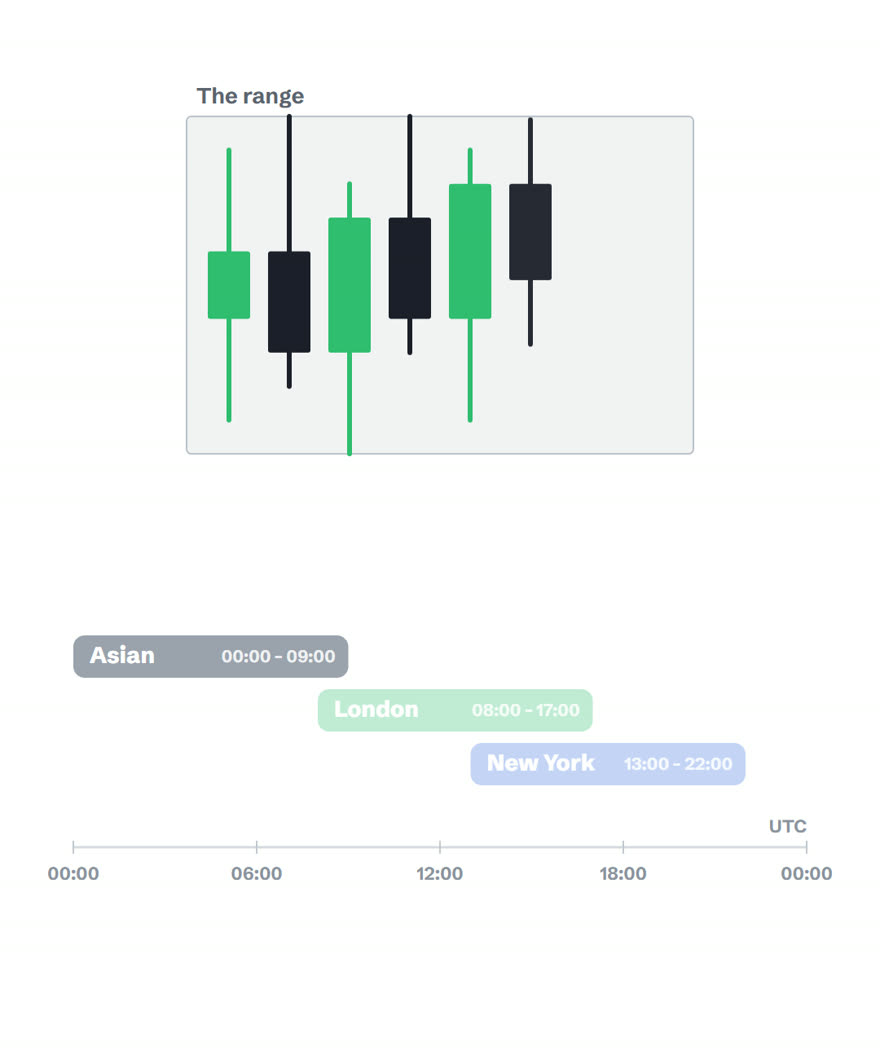
While Tokyo, Sydney and Singapore are the only centres open, volume is thin and price mostly drifts sideways. If you are new, this is the session that tricks you into thinking nothing ever happens, and into forcing trades inside a range that is not going anywhere.
But the Asian session is doing a job: it is quietly building the day's key levels. The high and low of that range collect stops and pending orders, and those orders are exactly what the next session comes hunting for. Mark the Asian high and low, then be patient.
Session 2: London, the trend starter (08:00 to 17:00 UTC)
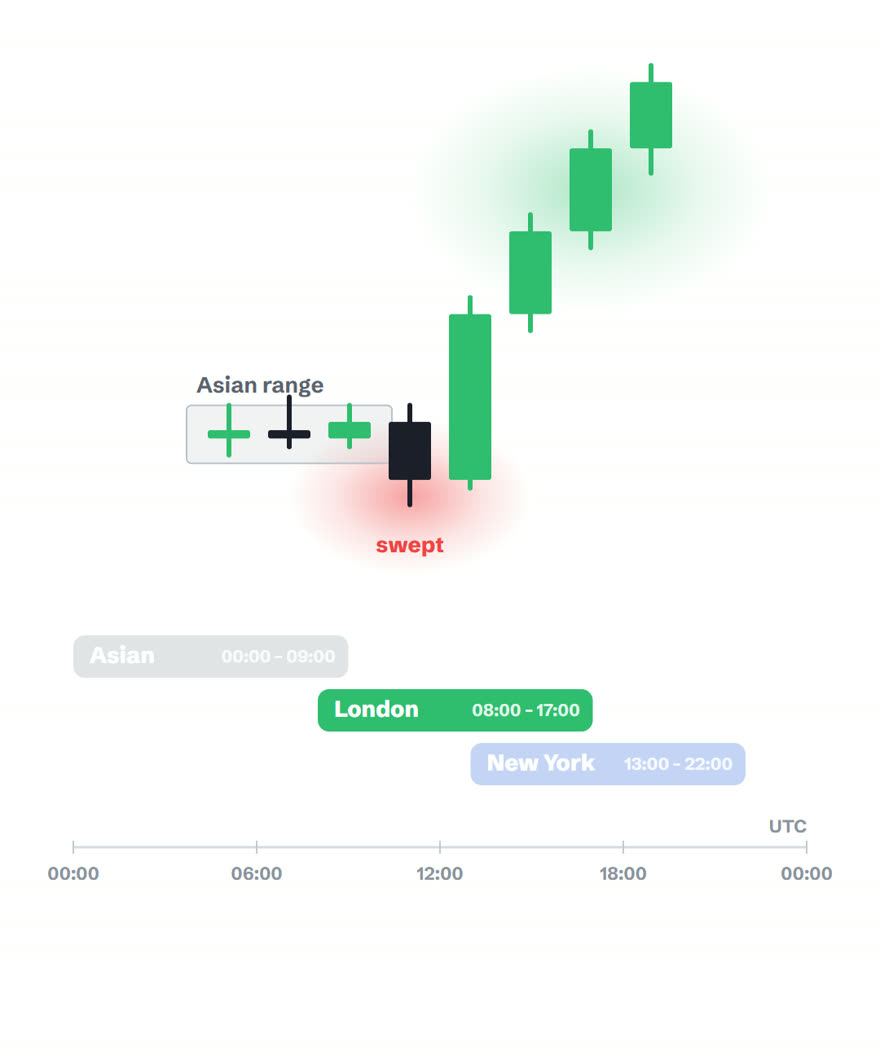
Then London wakes up and everything changes. London is the biggest forex session on the planet, and when it opens the volatility comes alive. Watch what it does with the Asian range: very often the first move is a sweep, a push through the Asian high or low that collects the stops sitting there, before the real trend of the day kicks off in the opposite direction.
That sweep then reverse pattern is the same mechanic as the fair value gap entry: let the fake move happen, then trade the real one. The London open is where that setup prints most reliably.
Session 3: New York and the overlap (13:00 to 22:00 UTC)
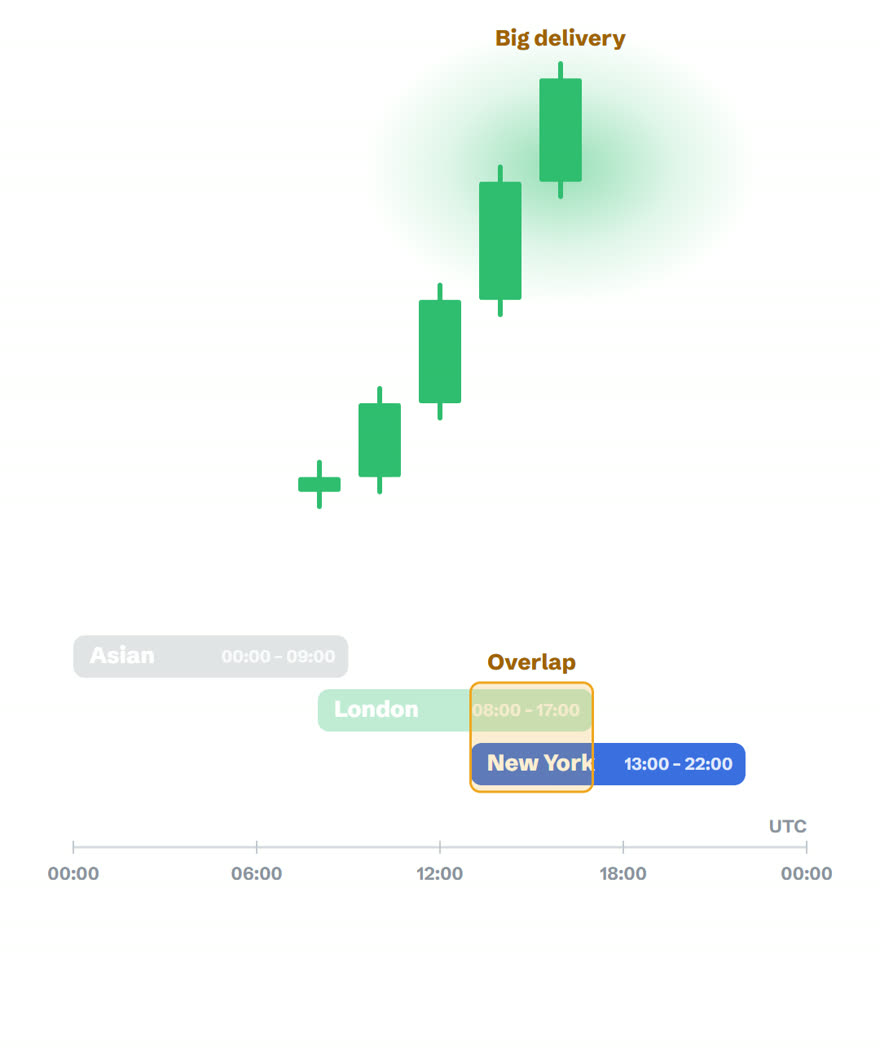
New York opens while London is still going, and from roughly 13:00 to 17:00 UTC both giants are trading at the same time. That overlap is the busiest, most volatile stretch of the entire day: the most volume, the tightest spreads, and the window where the big moves usually get delivered. US news releases also land in this window, which adds fuel; check the calendar before trading through them.
The six levels the sessions leave behind
Everything above is the map. This is what you actually trade off it. Each session leaves a high and a low behind, and those old edges are where the orders sit. You do not need indicators for this, and you do not need an opinion about direction. You need six lines and a start time.
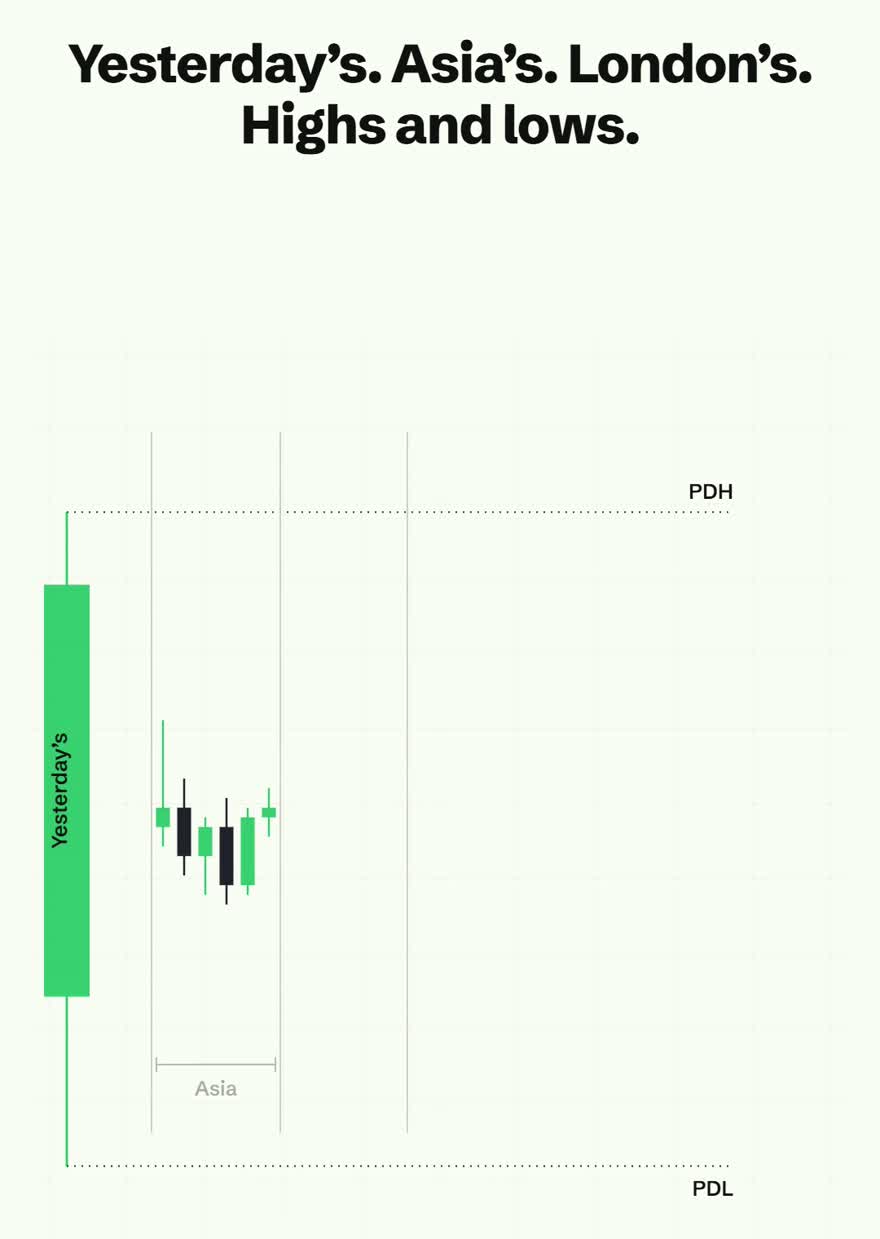
Before New York opens, mark yesterday's high and low. Draw them straight off the daily candle so you know exactly where they came from. These two are the widest levels on your chart and they hold the most orders, because every trader on every timeframe can see them.
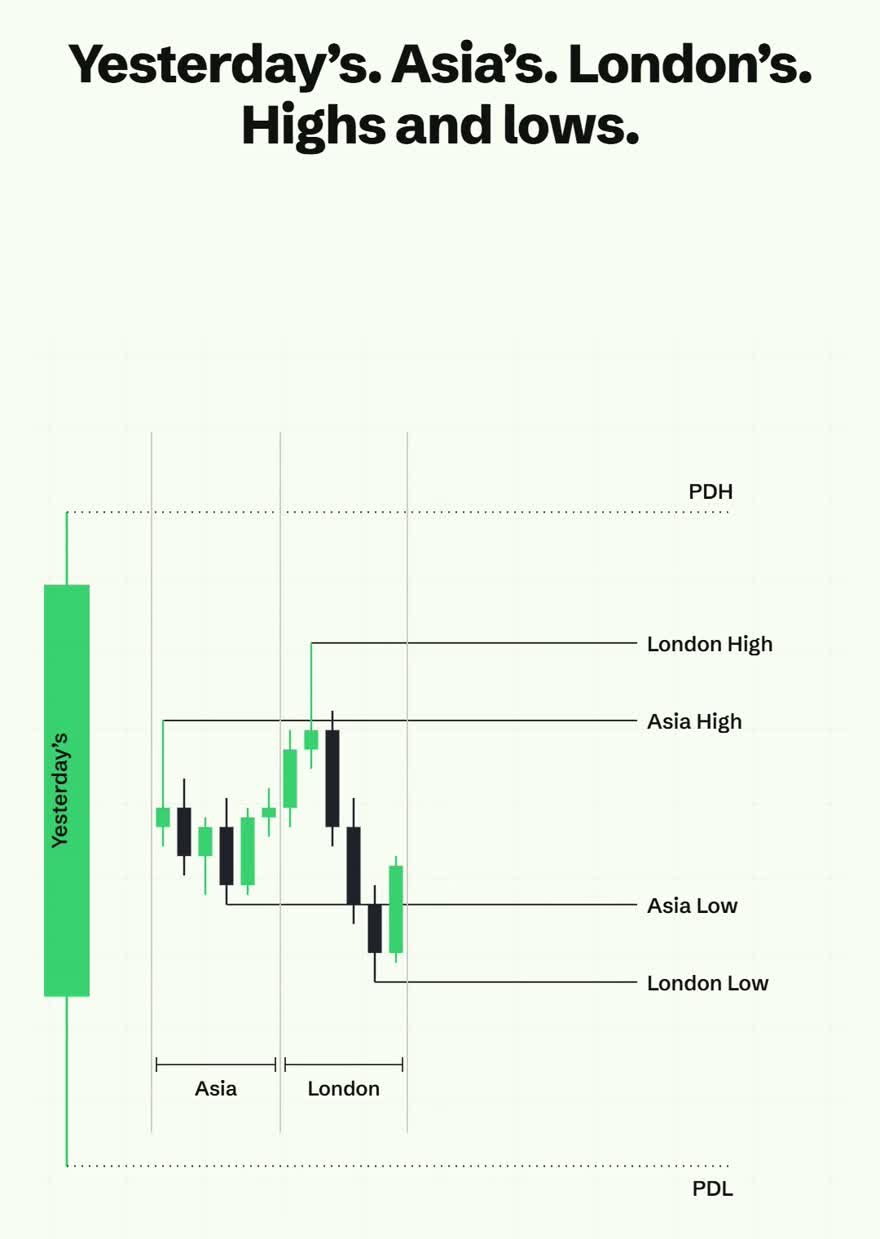
Then mark the high and low of the Asian session. That quiet range you read about above is not wasted time. It is the market building a box, and the edges of that box become targets once London and New York show up.
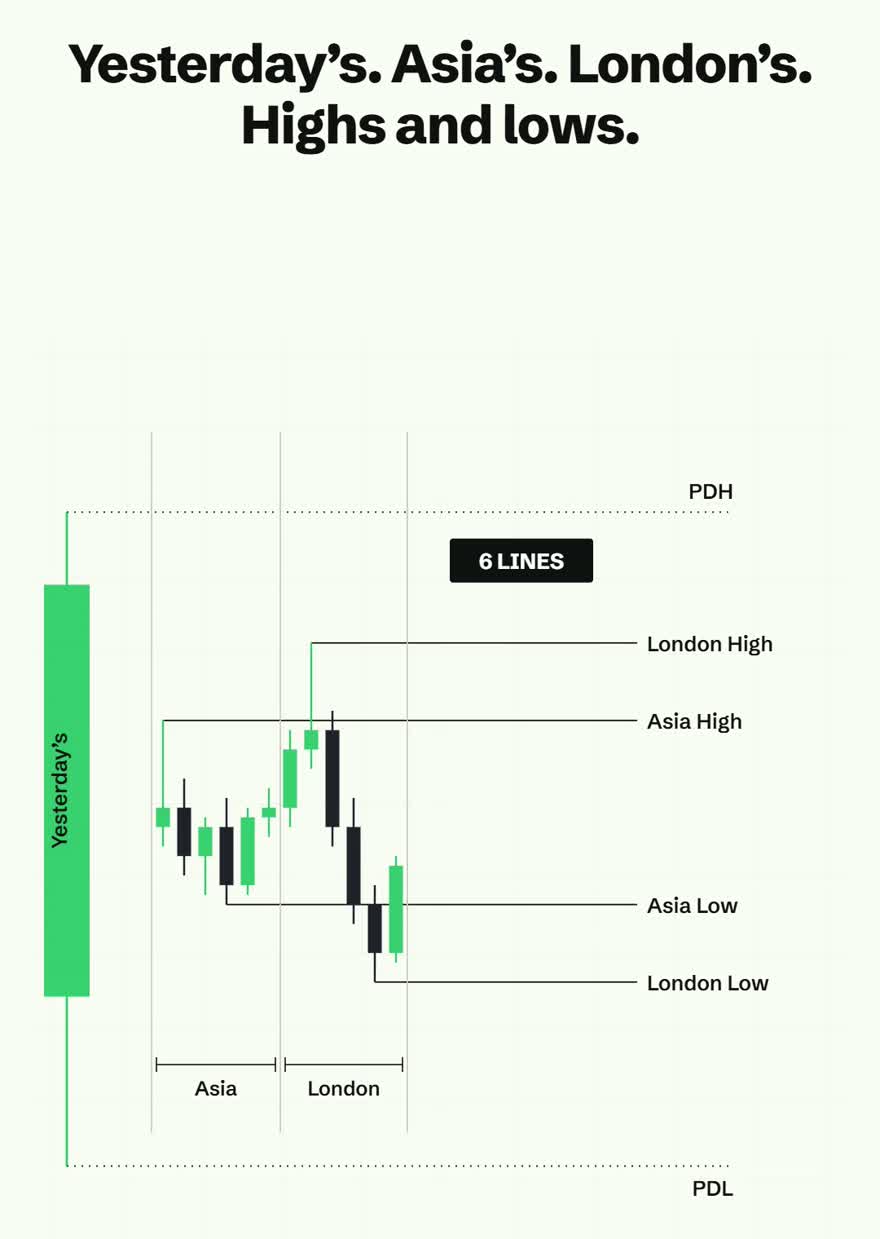
Finally, the high and low of London. That is six lines: previous day high, previous day low, Asia high, Asia low, London high, London low. Nothing else goes on the chart. Those are the levels the market is actually hunting, and they are the same six every single day.
Why price goes and takes them
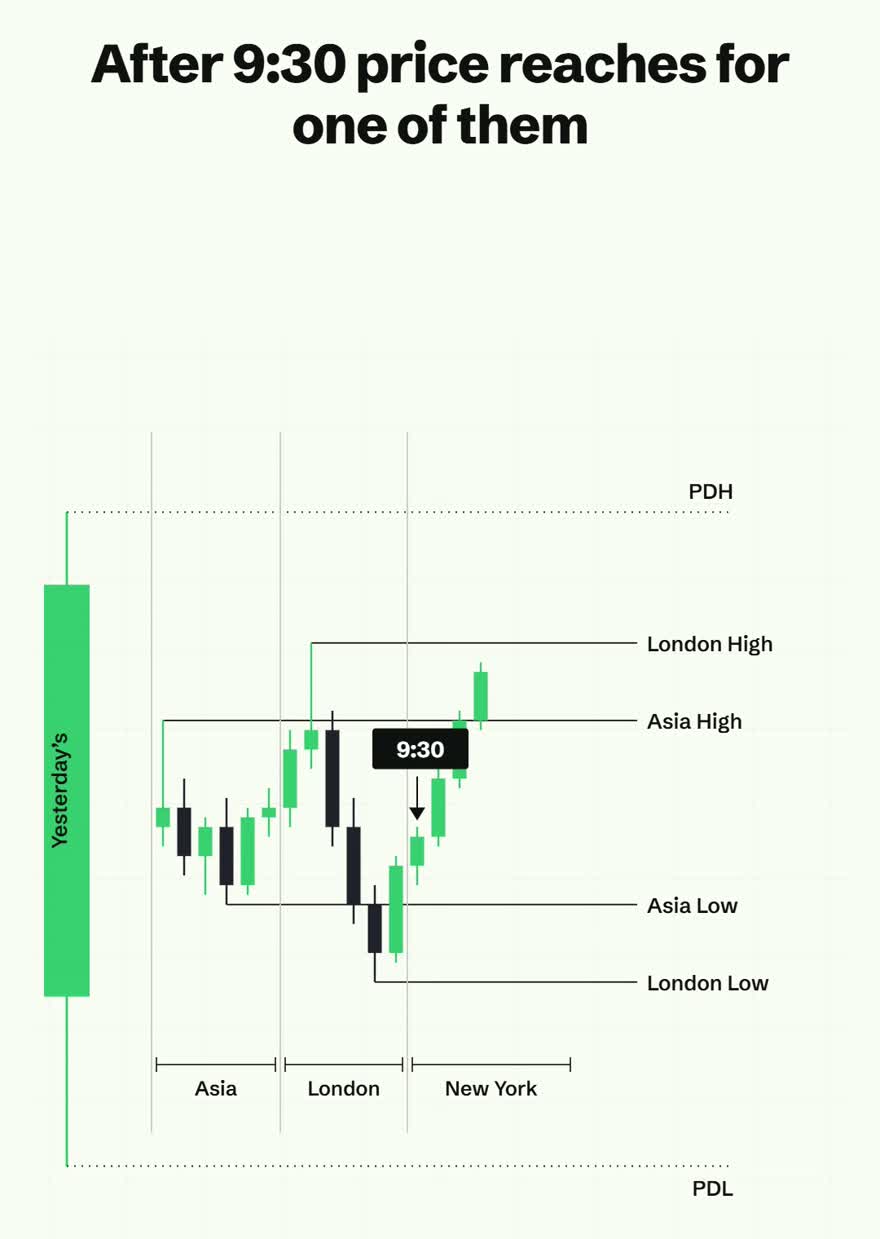
After 9:30 New York, price will reach for one of those levels. Not because it is random, but because that is where the stops are. Every trader who bought near the London high has a stop just under it. Everyone who sold near the Asian low has a stop just above it. Those stops are orders, and orders are the only thing that lets a big position get filled.
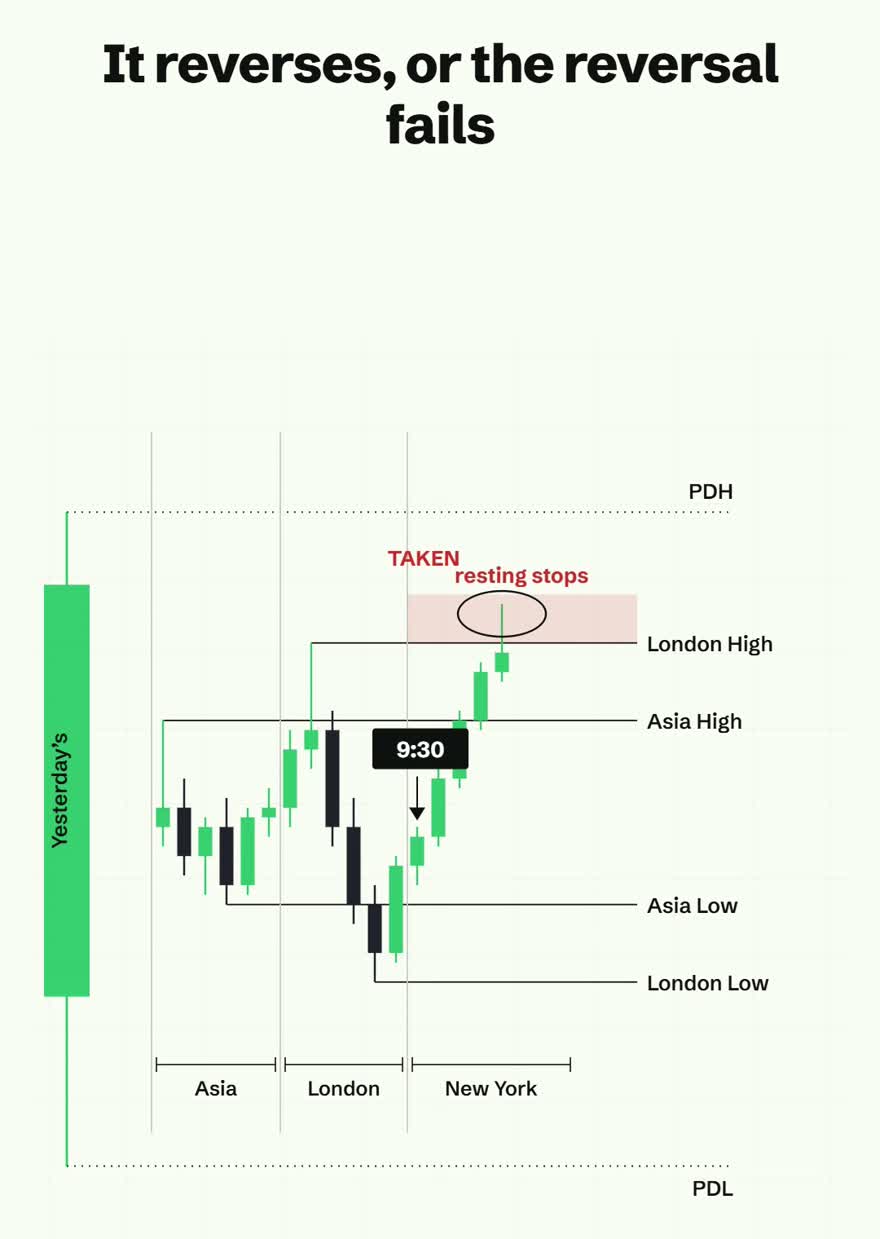
So price goes and takes the level. It runs the stops, and the candle wicks through. That moment is the one worth waiting for, because once the level is taken, only two things can happen next.
Outcome one: it reverses
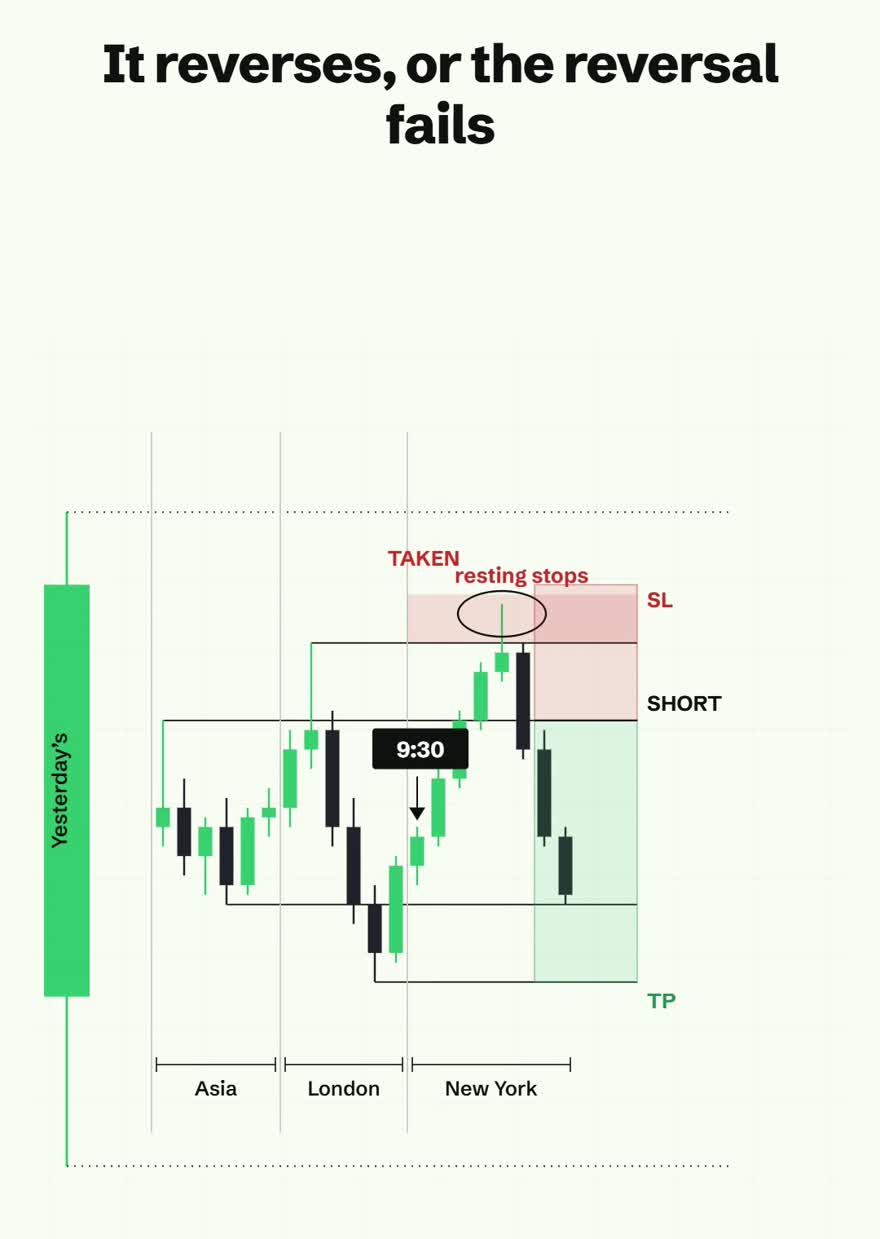
Price takes the level, rejects it, and turns straight back around. That is the classic raid and reverse. Your stop goes above the high that just got swept, because if price trades back through there the idea was wrong. Your target is the next level you already marked, which in this example is the London low. You are not guessing where to exit. The exit was on the chart before the trade existed.
Outcome two: the reversal fails
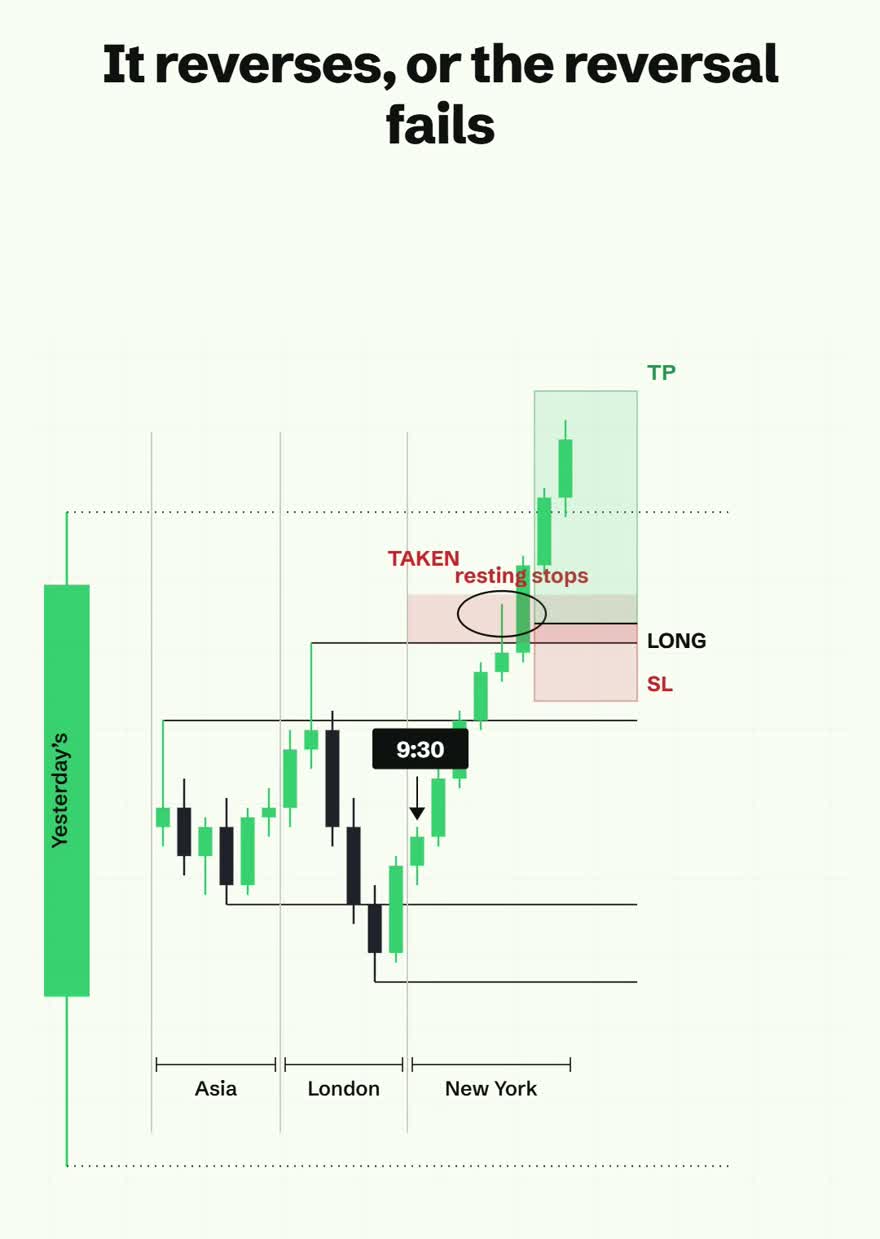
Sometimes the rejection never comes. Price takes the level, hesitates, then drives straight back through it and keeps going. That is a failed reversal, and it is usually the bigger move of the two, because everyone who shorted the raid is now trapped and has to buy their losses back.
Most traders only ever learn the first outcome. They see the sweep, take the reversal, and when it fails they call it a bad setup. It was not a bad setup. It was the other half of the same setup, and it pays better.
The whole method on one page
- Before New York opens, mark six lines: yesterday's high and low, Asia's high and low, London's high and low
- Wait for 9:30 New York. Do not trade the build-up
- Watch which level price reaches for, and let it take the level properly
- If it rejects and turns, short or buy the reversal with your stop beyond the sweep
- If the reversal fails and price drives back through, take the continuation instead
- Either way, your target is the next marked level, not a number you invented
Same levels, same time, every day. That is the entire edge, and it is why this is a routine rather than a prediction.
Watch the full breakdown
The takeaway: match the session, lose the confusion
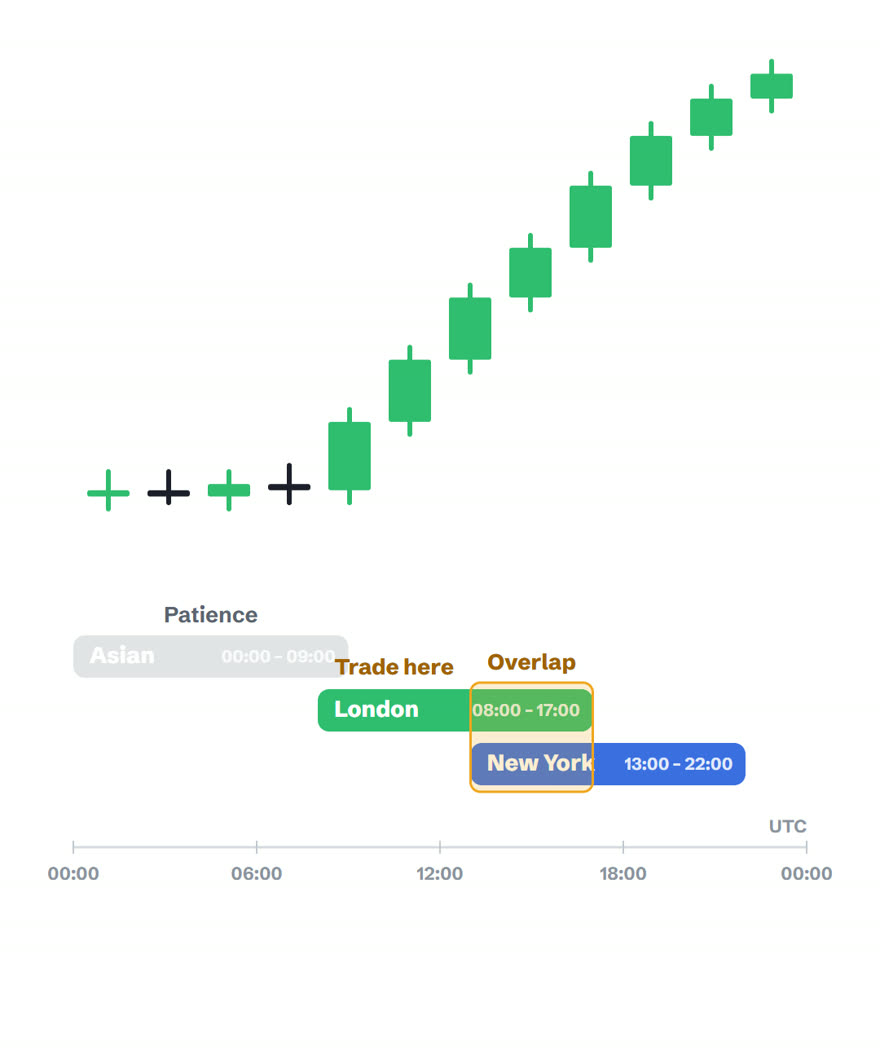
- Want movement: trade the London session and the London to New York overlap
- Asian session: preparation, not action. Mark the range, set your levels, wait
- Late New York (after 17:00 UTC): volume fades, moves get choppy, be selective
- One habit: before any trade, ask which session am I in, and is this window known for trends or ranges
One honest exception: synthetic indices
Sessions matter on forex, gold and index CFDs because they follow real-world volume. Deriv's synthetic indices do not: Volatility 75, Boom and Crash run on a random number generator 24 hours a day, so there is no session pattern to trade there, whatever anyone on YouTube claims. On synthetics, trade the chart pattern, not the clock.
Put it to work
Convert the session times to your own timezone once and write them down. Then open a free demo, pick one session-driven market, and just watch the handover for a week: Asian range, London sweep, overlap delivery. Pair what you see with the opening range strategy, run every setup through the pre-trade checklist, and if candles and structure are still new, start with the free beginner course.
Try trading free, $10,000 virtual demo →Frequently asked questions
What are the three main trading sessions?
Which session is the most volatile?
What time is the London session in my timezone?
Why does the market go quiet during the Asian session?
Do sessions matter on Deriv synthetic indices?
Can I practise session-based trading for free?
How do I mark the six session levels?
Why does price keep taking out session highs and lows?
What do I do after price takes a session level?
Which session level is the most important?
What time do I start watching?

Keep learning
New to trading entirely? Start with the free beginner course: 20 short lessons from zero to your first demo trade.